
SQL + Tableau Ad Campaign Analysis: From Dirty Data to Insightful Dashboards
May 30, 2025 • 3 min read
SQL + Tableau Ad Campaign Analysis: From Dirty Data to Insightful Dashboards #
1. Why I Built This #
I wanted to build something real-world and business-relevant, something that went beyond technical skill and showed I could tell a story with data. Marketing spend is a perfect topic for that.
Companies often dump money into ads without really knowing which campaigns are working. So I created a full workflow that starts with messy marketing data and ends with a clean, actionable dashboard that shows which campaigns actually delivered results.
2. How I Built It #
I started with a raw CSV of ad campaign data. To make the project more realistic (and more impressive), I simulated common data issues like:
- Typos and inconsistent text
- Null values
- Duplicates
- Outliers
The Stack: #
- SQL for cleaning, exploration, and building insights
- Python for previewing the data
- Tableau for creating an interactive story-driven dashboard
I broke the SQL work into modular scripts:
inject_dirty_data.sqlcleaning_steps.sqlexploration_steps.sqlanalysis_queries.sql
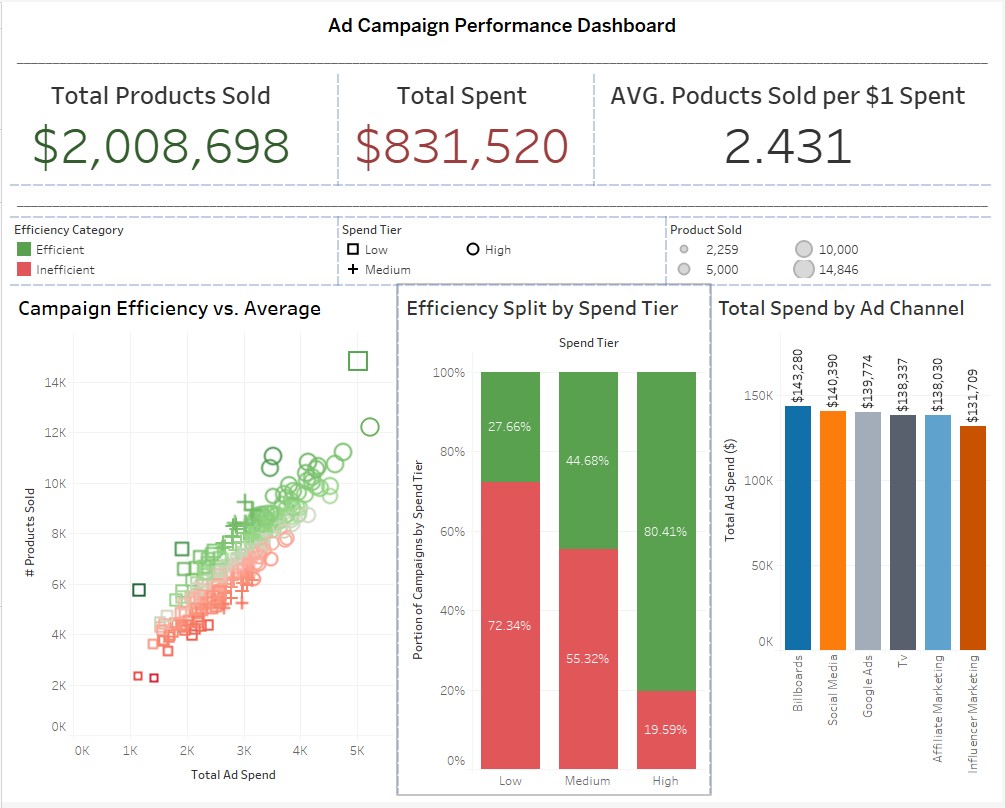
Then I brought the clean data into Tableau and built a full KPI section, bar charts, scatter plots, and boxplots that told the story of which campaigns performed — and which didn’t.
3. Trade-Offs and Decisions #
Product per Dollar vs Z-Score Efficiency #
Originally I tried using a simple Products Sold per $1 Spent metric. It was interpretable, sure but it didn’t tell the whole story.
That’s why I created a custom Efficiency Index using z-scores, which centered performance around the average and let me easily see who over or underperformed.
What Counts as “Efficient”? #
I categorized campaigns as “Efficient” or “Inefficient” based on whether they scored above or below average. It made for cleaner visuals and simpler insights without sacrificing nuance.
4. What I Took Away from This #
This project helped me level up in a few major ways:
- SQL cleaning: I now feel confident dealing with messy data in SQL, even creating my own “dirty” dataset to prove I can handle it.
- Data storytelling: Tableau made it easy to explore patterns, but I learned how to turn those into insights especially when comparing spend tier performance.
- Realism matters: Injecting dirty data made the project feel authentic, not canned. It also let me show I can spot and fix issues that would break dashboards in the real world.
5. The Dashboard and the Data #
If you’re curious to explore it all visually:
6. Let’s Connect #
If you’ve got thoughts, want to collaborate, or just like clean data and good dashboards, feel free to connect:
Last updated on May 30, 2025