
Building My Churn Prediction App: What Worked, What Didn’t, and What I Learned
May 25, 2025 • 3 min read
Building My Churn Prediction App: What Worked, What Didn’t, and What I Learned #
1. Why I Built This #
Churn is one of those things companies hate but don’t always act on until it’s too late. I wanted to build something that could actually help with that — a tool that predicts when a customer might leave and gives some insight into why.
I’ve been learning data science and decided this would be a great project to push myself a bit. I didn’t just want to build a model in a notebook. I wanted to go all the way — data cleaning, model building, tuning, and actually deploying it as something people could interact with.
2. How I Built It #
I started with a telecom churn dataset and built three models:
- Logistic Regression
- Random Forest
- Tuned Random Forest (using
GridSearchCV)
I didn’t just look at accuracy — churn is an imbalanced problem, so I focused more on:
- Recall for churners (catching them early matters)
- Precision (avoiding false alarms)
- ROC-AUC for overall separation
I used class weights to help balance things out and made sure to visualize ROC and Precision-Recall curves so I could actually understand how each model was behaving.
3. Trade-Offs and Decisions #
Logistic Regression had better recall — it flagged more potential churners, but with more false positives. Random Forest was more precise — fewer wrong guesses, but it missed some churners. The tuned version helped balance that out a bit.
Rather than trying to pick one “best” model, I built the app to let users choose between the three. That way, they can decide based on what matters more for their situation — catching every churner or being more cautious.
4. What Went Wrong (and How I Fixed It) #
This wasn’t all smooth sailing. Two big challenges came up:
Model Prediction Issues #
At first, the app’s predictions didn’t match what I was getting in my notebook. After a bit of head-scratching, I realized I hadn’t included all the .pkl files needed for the app to work properly. Once I added the trained models, transformers, and encoders, things finally lined up.
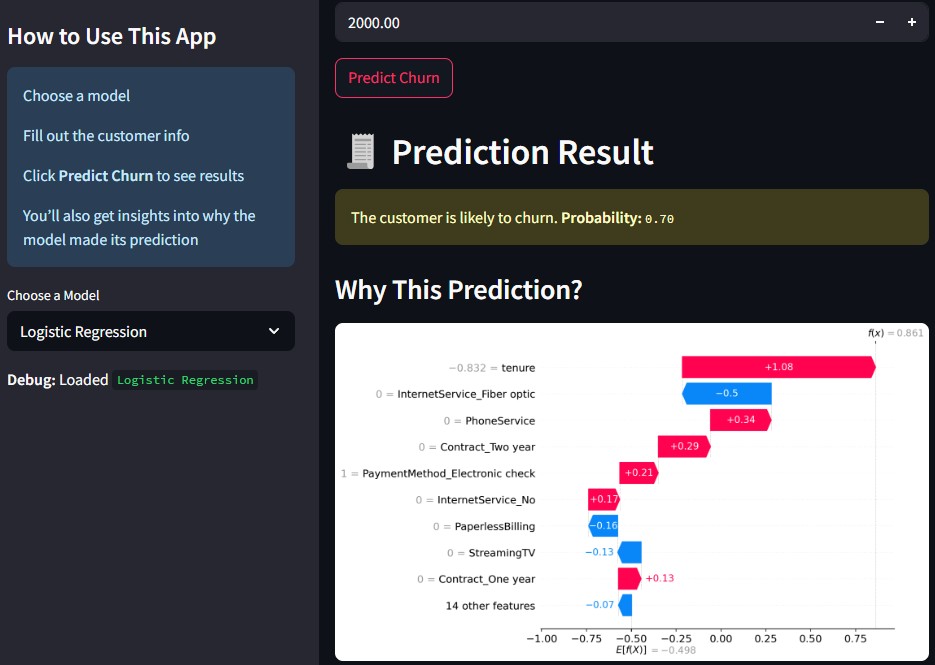
SHAP Limitations #
I originally wanted to include SHAP explanations for all three models. Unfortunately, I could only get it to work reliably with Logistic Regression. For the Random Forest models, SHAP just wasn’t playing nice in the app.
So I pivoted. Instead of live explanations, I added static feature importance images that show the most influential features for those models. Not ideal, but still helpful.
5. What I Took Away from This #
Here’s what I learned:
- Just because something works in a notebook doesn’t mean it’ll work in an app — especially if you forget to package everything.
- SHAP is powerful, but also picky. Sometimes you have to adjust your plan.
- Explaining why a model made a decision helps a lot — even if it’s just a bar chart.
More than anything, I learned how to build something real from start to finish — and deploy it for others to try.
6. Give the App a Try #
If you’re curious to see how it works:
If you have questions or just want to connect, feel free to message me on LinkedIn.
Last updated on May 25, 2025